
RNA sequencing (RNA-seq) has become a fundamental technology in molecular biology, genomics, biotechnology, and biomedical research. By enabling the comprehensive analysis of RNA molecules within biological samples, this approach provides valuable insights into gene expression, cellular activity, molecular regulation, and biological responses to environmental or experimental conditions.
However, generating sequencing data is only the first step. The real scientific value of RNA-seq lies in the systematic processing, statistical analysis, and biological interpretation of complex transcriptomic datasets. From quality control and read alignment to differential gene expression and functional enrichment, each analytical stage contributes to transforming millions of sequencing reads into meaningful biological information.
Understanding RNA sequencing data analysis and interpretation is therefore essential for researchers seeking to investigate molecular mechanisms, identify candidate biomarkers, characterize cellular responses, and develop evidence-based hypotheses for further experimentation.
Understanding the Principles of RNA Sequencing
RNA sequencing is a high-throughput sequencing approach used to characterize the RNA molecules present in a biological sample. Depending on the experimental design, RNA-seq can provide information about messenger RNA abundance, non-coding RNA expression, alternative splicing, transcript structure, and other aspects of transcriptomic organization.
The workflow generally begins with RNA extraction, followed by RNA quality assessment, library preparation, and high-throughput sequencing. The resulting reads are then processed computationally to estimate transcript abundance and investigate differences between biological samples.
Different RNA-seq strategies address different research questions. Poly(A) selection is commonly used to enrich polyadenylated transcripts, whereas ribosomal RNA depletion can support the analysis of a broader range of RNA species. Single-cell RNA sequencing provides information about gene expression at the individual-cell level, while bulk RNA-seq measures the combined expression profile of a population of cells.
The choice of sequencing strategy influences the type of information obtained and determines which computational methods are most appropriate.

The RNA Sequencing Data Analysis Workflow
A reliable RNA-seq analysis requires a series of interconnected steps. Each stage must be evaluated carefully because technical errors, inappropriate statistical assumptions, or unsuitable reference resources can influence downstream conclusions.
1. Quality Control of Sequencing Reads
Quality control is the first computational step in RNA sequencing data analysis. Its purpose is to assess the technical reliability of sequencing reads before further processing.
Researchers typically examine:
Per-base and per-read sequencing quality scores.
Read length distributions.
GC content and nucleotide composition.
Adapter contamination.
Sequence duplication levels.
Overrepresented sequences and potential technical artifacts.
Tools such as FastQC and MultiQC are frequently used to inspect individual sequencing files and summarize quality metrics across multiple samples.
Adapter contamination and low-quality terminal bases may require trimming, although filtering should be guided by the observed data and the sequencing protocol rather than applied automatically.
Quality control also helps identify potential sample-specific problems, including unexpectedly low read quality, unusual nucleotide composition, or substantial differences between sequencing libraries.
A key principle is that quality metrics should be interpreted in their biological and technical context. For example, elevated duplication levels can reflect PCR amplification, but they may also occur naturally in highly expressed transcripts.
2. Read Trimming and Preprocessing
Sequencing reads may contain technical sequences or low-quality regions that interfere with downstream analysis. Preprocessing can remove adapters and, when justified, trim low-quality bases.
Tools such as Cutadapt and fastp support adapter removal and read preprocessing. Their output should be examined to determine whether the procedure improved read quality without removing excessive amounts of useful sequence information.
Over-trimming can reduce alignment efficiency and compromise the detection of certain transcripts. Consequently, preprocessing decisions should be documented and applied consistently across comparable samples.
Paired-end sequencing requires additional attention because both reads from a fragment must be handled appropriately to preserve information about fragment orientation and pairing.

3. Read Alignment and Transcript Quantification
After preprocessing, sequencing reads are mapped to a reference genome or quantified against a transcriptome reference.
Genome alignment allows researchers to investigate where reads originate and can support analyses of gene expression, alternative splicing, transcript structure, and novel transcriptional events. Commonly used aligners include STAR and HISAT2.
Alternatively, lightweight or selective-alignment approaches can estimate transcript abundance more efficiently. Salmon and kallisto are widely used for transcript quantification without requiring conventional full-genome alignment for every read.
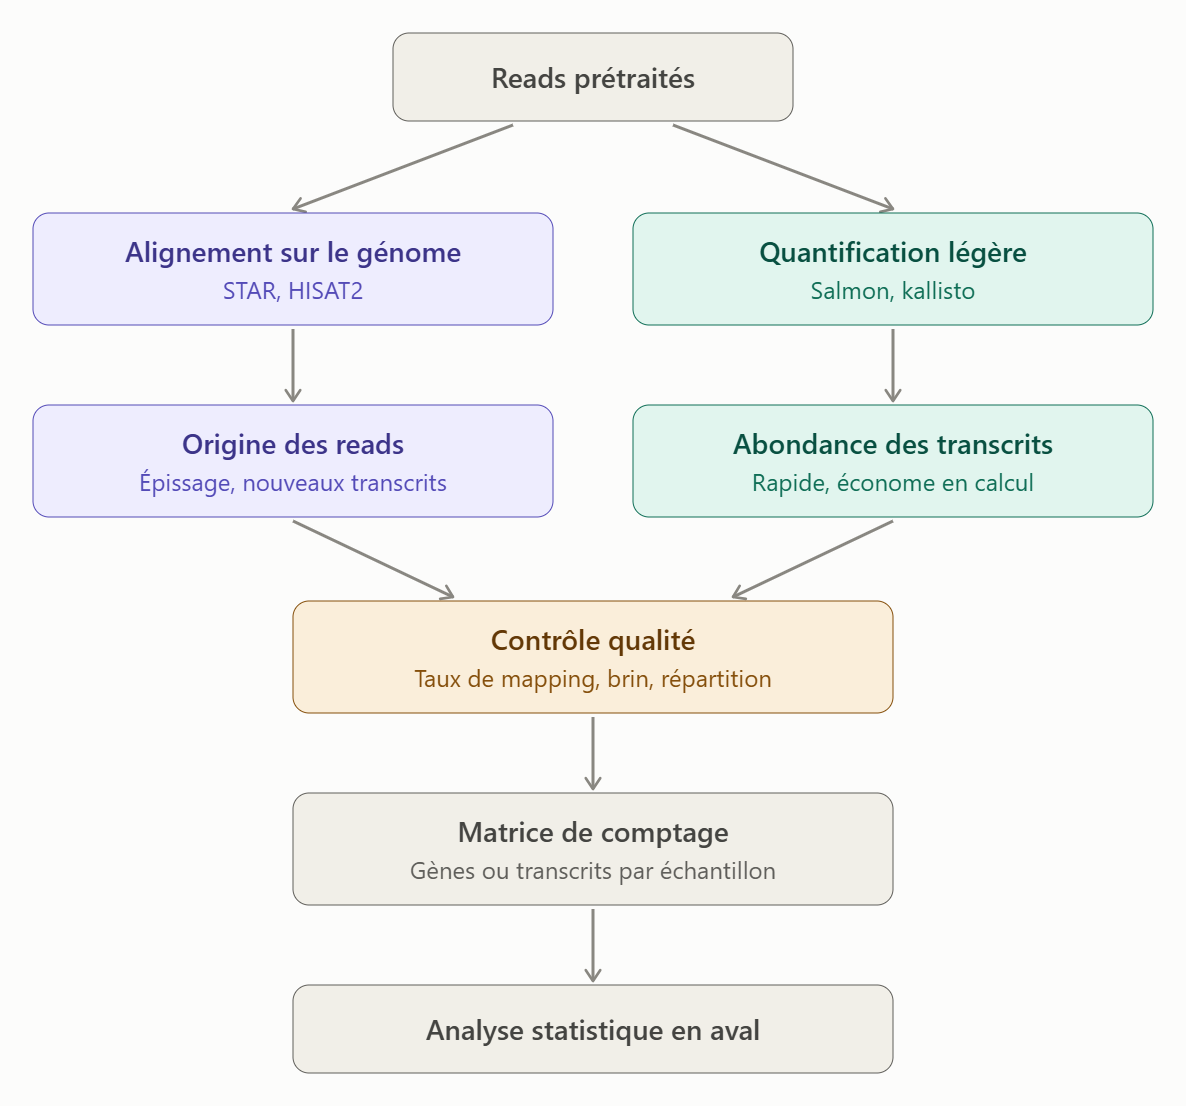
The choice depends on the research objective, computational resources, reference annotation, and the level of transcript-level resolution required.
Alignment quality can be assessed through mapping rates, the distribution of reads across genomic features, strandedness, and other protocol-specific metrics. Unexpectedly low mapping rates may indicate contamination, poor reference compatibility, sample quality problems, or technical inconsistencies.
Once reads have been assigned to genes or transcripts, the resulting count matrix or abundance estimates provide the basis for downstream statistical analysis.
4. Constructing the Expression Matrix
The expression matrix organizes sequencing measurements into a structured dataset. Typically, rows represent genes or transcripts, while columns represent biological samples.
For gene-level differential expression analysis, raw integer counts are commonly used with statistical methods that model count variability. Tools such as DESeq2 and edgeR are designed for this purpose.
Transcript abundance may also be expressed as TPM (transcripts per million), which supports comparisons of relative transcript abundance within samples under appropriate conditions. However, TPM values should not be substituted indiscriminately for raw counts in statistical workflows that expect count data.
Expression matrices must be checked for duplicated identifiers, missing annotations, inconsistent gene naming, and samples with unusual library sizes.
Normalization is essential because sequencing libraries can differ in depth and RNA composition. Methods such as median-of-ratios normalization in DESeq2 and trimmed mean of M-values normalization in edgeR help account for relevant differences between samples.
Normalization does not eliminate every technical bias. Batch effects, RNA degradation, differences in cellular composition, and other confounding factors may require separate investigation.
Differential Gene Expression Analysis
Differential gene expression analysis identifies genes whose expression differs between biological conditions, such as treated and untreated cells, healthy and diseased tissues, or different developmental stages.
The objective is not simply to identify genes with different observed counts. Instead, statistical models estimate expression differences while accounting for variability between biological replicates and the characteristics of the experimental design.
Defining the Experimental Design
A clear experimental design is fundamental to reliable interpretation. Researchers should define the biological conditions, number of biological replicates, relevant covariates, and comparisons before conducting the analysis.
For example, a study comparing control cells with treatment-exposed cells may investigate whether a treatment changes the expression of genes involved in oxidative stress, inflammation, metabolism, or cellular signaling.
Biological replicates are particularly important because they capture variation between independent biological samples. Technical replicates may help assess measurement variability but cannot replace independent biological replication.
When samples are collected across different batches, time points, donors, or experimental conditions, these variables should be incorporated into the statistical model when appropriate.
Log2 Fold Change and Statistical Significance
Differential expression results commonly include log2 fold change, a measure of the magnitude and direction of an expression difference.
A positive log2 fold change indicates higher expression in the specified comparison group, whereas a negative value indicates lower expression. Interpretation depends on the reference condition and the order of the comparison.
Statistical significance is often assessed through hypothesis testing followed by multiple-testing correction. Since RNA-seq experiments may evaluate thousands of genes simultaneously, controlling the false discovery rate is important.
The Benjamini–Hochberg procedure is widely used to calculate adjusted p-values.
Researchers frequently apply an adjusted p-value threshold, such as 0.05, but this threshold should be defined in advance and interpreted alongside effect size, biological relevance, and study design.
A statistically significant difference is not automatically biologically important. Conversely, a potentially meaningful expression change may remain statistically uncertain when sample size is limited or biological variability is high.
Interpreting Differential Expression Results
A typical differential expression table contains gene identifiers, average expression estimates, log2 fold changes, statistical test results, and adjusted p-values.
The analysis should consider both the magnitude of expression changes and the reliability of the estimates. Genes with extremely low counts may produce unstable fold changes, while genes with consistent expression differences across replicates may provide stronger evidence of a reproducible response.
Useful visualizations include:
Volcano plots showing effect size and statistical significance.
MA plots comparing expression abundance with fold change.
Heatmaps displaying normalized expression patterns.
Sample-level plots illustrating variability and clustering.
These representations make it easier to identify expression patterns, assess outliers, and communicate the main results of the study.

Exploring Global Transcriptomic Patterns
Differential expression focuses on individual genes, but broader analyses help reveal relationships between samples and the overall organization of transcriptomic data.
Principal Component Analysis
Principal component analysis (PCA) reduces high-dimensional expression data into a smaller number of components that summarize major sources of variation.
A PCA plot can reveal whether biological replicates cluster together, whether experimental groups show distinct patterns, and whether technical variables may influence the dataset.
However, PCA separation does not establish a causal biological mechanism. Differences may reflect treatment effects, batch effects, donor variability, cell composition, or other factors.
PCA is most informative when interpreted alongside experimental metadata and complementary quality-control results.
Hierarchical Clustering and Heatmaps
Hierarchical clustering groups samples or genes according to similarities in their expression profiles. Heatmaps provide a visual representation of these patterns, often using appropriately transformed and scaled expression values.
These methods can help identify groups of co-expressed genes, compare biological conditions, and detect samples with unexpected expression profiles.
For visualization, variance-stabilizing transformations or other suitable transformations may be used to reduce the influence of differences in expression magnitude. Row-wise scaling can highlight relative patterns across samples, but it removes information about absolute expression levels.
Clustering results depend on the selected distance measure, linkage method, gene set, and normalization procedure. Therefore, visual groupings should be treated as exploratory evidence rather than definitive proof of biological relationships.

Functional Enrichment and Pathway Analysis
A list of differentially expressed genes is often difficult to interpret without considering their biological functions. Functional enrichment analysis helps determine whether particular biological categories are represented more frequently than expected within a selected gene list.
Gene Ontology Analysis
Gene Ontology (GO) provides a structured framework for describing gene products through three main categories:
Biological Process: the broader biological activities in which genes participate.
Molecular Function: the biochemical activities associated with gene products.
Cellular Component: the cellular structures or locations associated with gene products.
Enrichment analysis can identify overrepresented categories related to processes such as immune regulation, cell-cycle progression, mitochondrial activity, transcriptional control, or cellular stress responses.
The background gene set must be selected carefully. Using genes that could reasonably have been detected in the experiment is often more appropriate than using every gene in the genome.

Pathway Analysis
Pathway analysis investigates whether genes associated with known biological pathways show evidence of coordinated activity or differential expression.
Resources such as KEGG, Reactome, and curated molecular pathway collections can support the interpretation of signaling networks, metabolic processes, immune responses, and other cellular mechanisms.
Two broad strategies are commonly used.
Over-representation analysis tests whether a selected list contains more genes associated with a pathway than expected by chance. Gene set enrichment analysis (GSEA), by contrast, evaluates whether members of a gene set tend to occur toward one end of a ranked gene list.
GSEA can detect coordinated expression shifts even when individual genes do not meet a predefined differential expression threshold.
Nevertheless, enrichment results depend on gene annotation quality, pathway definitions, gene-list selection, and statistical correction. A pathway described as enriched should not automatically be interpreted as activated or inhibited. Directionality requires additional evidence, including the expression patterns of relevant pathway components and the assumptions of the analytical method.
RNA Sequencing and Alternative Splicing
RNA-seq can provide information about alternative splicing, a process through which different RNA transcripts are generated from the same gene.
Alternative splicing can influence protein structure, transcript stability, and cellular function. It is particularly relevant in developmental biology, neurological research, cancer biology, and investigations of tissue-specific gene regulation.
Splicing analysis may examine exon inclusion, exon skipping, alternative splice sites, intron retention, and changes in transcript usage.
Tools such as rMATS and SUPPA2 can support the identification of differential splicing events, depending on the data type and experimental design.
These analyses require careful consideration of read coverage, sequencing depth, annotation completeness, and statistical power. Gene-level differential expression alone cannot establish whether a gene undergoes altered splicing.
For this reason, transcript-level or event-level analyses can complement gene-level expression results and reveal regulatory changes that might otherwise remain undetected.
Gene Co-Expression and Network Analysis
Gene co-expression analysis examines relationships between expression profiles across samples. Genes with similar expression patterns may participate in related biological processes or respond to shared regulatory influences.
Weighted gene co-expression network analysis (WGCNA) is one approach used to identify groups of correlated genes, often referred to as modules.
Researchers can investigate whether particular modules are associated with experimental conditions, phenotypic measurements, or clinical characteristics. Highly connected genes within a module may be considered candidates for further study.
However, co-expression does not establish direct molecular interaction, regulatory control, or causality. Shared expression patterns can arise from common upstream regulators, cellular composition differences, or indirect biological relationships.
Network findings should therefore be integrated with prior knowledge, independent datasets, and experimental validation wherever possible.

Common Challenges in RNA Sequencing Data Interpretation
Despite its analytical power, RNA-seq presents several challenges that can influence the reliability and reproducibility of biological conclusions.
Batch Effects and Confounding Variables
Batch effects occur when technical differences between experimental batches introduce systematic variation into gene expression measurements.
Sources may include different reagent lots, sequencing runs, sample preparation dates, or laboratory conditions. If batch and biological condition are strongly confounded, their individual effects may be impossible to distinguish statistically.
Experimental randomization, balanced sample processing, consistent protocols, and appropriate statistical modeling are important strategies for reducing this risk.
Low-Expression Genes and Limited Statistical Power
Genes with very low counts often provide limited evidence for reliable differential expression testing. Filtering genes with insufficient information can improve statistical performance, provided that filtering is performed using an appropriate, documented strategy.
Limited biological replication can also reduce the ability to detect genuine expression differences. Effect sizes and adjusted p-values should be interpreted in light of sample size, biological variability, and the number of genes tested.
Reference Genome and Annotation Limitations
Incorrect genome builds, incomplete gene annotations, outdated transcript identifiers, or species mismatches can affect read assignment and functional interpretation.
Researchers should document the reference genome, annotation version, software versions, and relevant database releases used in the workflow.
Consistent reference resources are especially important when comparing results across studies or integrating data from different sequencing projects.
Overinterpretation of Computational Results
Computational analyses generate evidence, not automatic confirmation of biological mechanisms.
An enriched pathway does not necessarily mean that the pathway is functionally activated. A gene associated with a disease does not automatically constitute a validated biomarker. Similarly, a predicted regulatory relationship requires independent evidence before it can be considered established.
Interpreting results in the context of the research question, experimental limitations, and existing literature helps prevent unsupported conclusions.
Applications of RNA Sequencing in Biological and Biomedical Research
RNA sequencing data analysis supports a broad range of scientific applications.
Neuroscience and Neurobiology
In neuroscience, RNA sequencing can help investigate neuronal differentiation, synaptic signaling, neuroinflammation, cellular stress responses, and molecular changes associated with neurological disorders.
Bulk RNA-seq provides an overview of the combined expression profile of the sampled tissue or cell population, whereas single-cell RNA-seq can distinguish transcriptional patterns among individual cell populations.
In studies of neuroprotection or oxidative stress, transcriptomic results may highlight candidate pathways associated with cellular defense, inflammatory signaling, mitochondrial function, or neuronal maintenance. Additional experiments are needed to determine whether these pathways directly contribute to the observed phenotype.
Developmental Biology and Cellular Differentiation
RNA-seq enables researchers to compare gene expression across developmental stages, differentiation protocols, and cell states.
These analyses can identify transcriptional programs associated with cell fate decisions, maturation, proliferation, and tissue organization.
Combining transcriptomic measurements with cellular phenotyping and time-course experiments can provide a more complete picture of how biological systems change over time.
Agricultural Biotechnology and Plant Research
In plant science, RNA-seq supports the study of gene expression during growth, development, pathogen exposure, and environmental stress.
Researchers can investigate transcriptional responses to drought, salinity, temperature changes, nutrient availability, and plant–microorganism interactions.
These findings can contribute to the identification of candidate genes and regulatory pathways relevant to plant adaptation, crop improvement, and molecular breeding.
Integrating RNA-seq with Other Omics Technologies
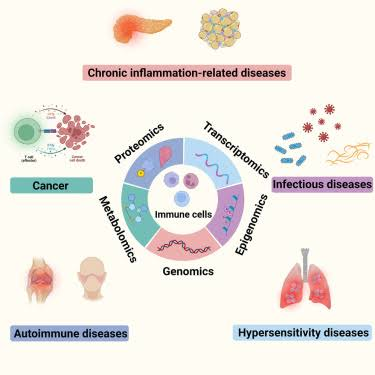
Transcriptomic data become more informative when integrated with complementary molecular datasets.
Combining RNA-seq with proteomics can help investigate the relationship between transcript abundance and protein levels. Metabolomics can provide information about biochemical changes associated with gene expression patterns, while epigenomic data can help explore regulatory mechanisms influencing transcription.
Genomic data can identify sequence variants that may contribute to expression differences, and single-cell or spatial transcriptomic technologies can provide additional information about cellular heterogeneity and tissue organization.
Multi-omics integration requires careful harmonization of sample identifiers, experimental conditions, measurement scales, and statistical assumptions. Correlations between different molecular layers can generate valuable hypotheses, but they do not independently establish causality.
The Role of Computational Tools and Artificial Intelligence
The increasing scale of RNA sequencing experiments has encouraged the development of more efficient computational pipelines, interactive visualization systems, and machine-learning approaches.
Automated workflows can improve consistency across analytical stages, while visualization platforms can help researchers explore complex datasets and communicate results.
Machine-learning methods may support sample classification, expression-pattern recognition, feature selection, and the prioritization of candidate biomarkers. However, their performance depends on data quality, sample size, model selection, and independent validation.
Potential risks include overfitting, data leakage, population bias, and limited generalizability across laboratories or biological contexts.
Artificial intelligence can assist with data exploration and hypothesis generation, but biological interpretation remains dependent on sound experimental design, appropriate statistical analysis, and critical scientific evaluation.
From Transcriptomic Measurements to Biological Conclusions
The interpretation of RNA-seq data should follow a logical progression from technical reliability to statistical evidence and biological meaning.
First, researchers assess whether the sequencing data are suitable for analysis. Next, they investigate global expression patterns and identify genes that differ between conditions. Functional and pathway analyses then help organize these findings into broader biological themes.
Finally, the results are evaluated against the original research question, relevant scientific literature, and independent evidence.
This approach reduces the risk of treating isolated statistical findings as complete biological explanations. It also supports the development of focused hypotheses that can be tested through additional computational analyses or laboratory experiments.